Week 4: Lv-1 Predictor

Effect Decomposition, Random Coefficient Model, and Cross-level Interactions

Week Learning Objectives

By the end of this module, you will be able to

  • Explain what the ecological fallacy is
  • Use cluster-mean/group-mean centering to decompose the effect of a lv-1 predictor
  • Define contextual effects
  • Explain the concept of random slopes
  • Analyze and interpret cross-level interaction effects

Task List

  1. Review the resources (lecture videos and slides)
  2. Complete the assigned readings
    • Snijders & Bosker ch 4.6, 5.1–5.3
  3. Attend the Tuesday Q&A + review session (optional)
  4. Attend the Thursday session and participate in the class exercise
  5. Complete Homework 4
  6. Now that you have learned the basics of MLM, start thinking about your project (Prospectus due around Oct 17)

Lecture

Slides

PDF slides

Check your learning
The Type I error inflation problem when using OLS regression for clustered data applies to


Check your learning

In the “bizarre” research finding that showed a correlation between chocolate consumption and number of Nobel prize winners at the country level, which of the following is reasonable to infer?


Check your learning

Summarize the “Big-Fish-Little-Pond Effect” in terms of how a person’s own academic performance and the overall performance of the person’s school on academic self-concept.

Between/within effects

Note

What I called “cluster-mean centering” is the same as “within-group centering” in Snijders & Bosker (2012)

Check your learning
Why do we need to separate a level-1 predictor into two variables in the model?


Path diagram and equations

Think more

Based on the between-cluster level component in the path diagram and in the equations, meanses can predict


Check your learning
Based on the results shown in the video, is the school-level slope or the student-level slope larger for the association between SES and math achievement?


Interpret the between/within effects

Try it yourself

Obtain the predicted mathach for Student B, and compare with Students A and C.

Check your learning: The contextual effect is

Check your learning
The contextual effect is


Developing intuition

Check your learning
In a random-coefficient model, if there are \(J\) cluster, there are


Equations and path diagram

Check your learning

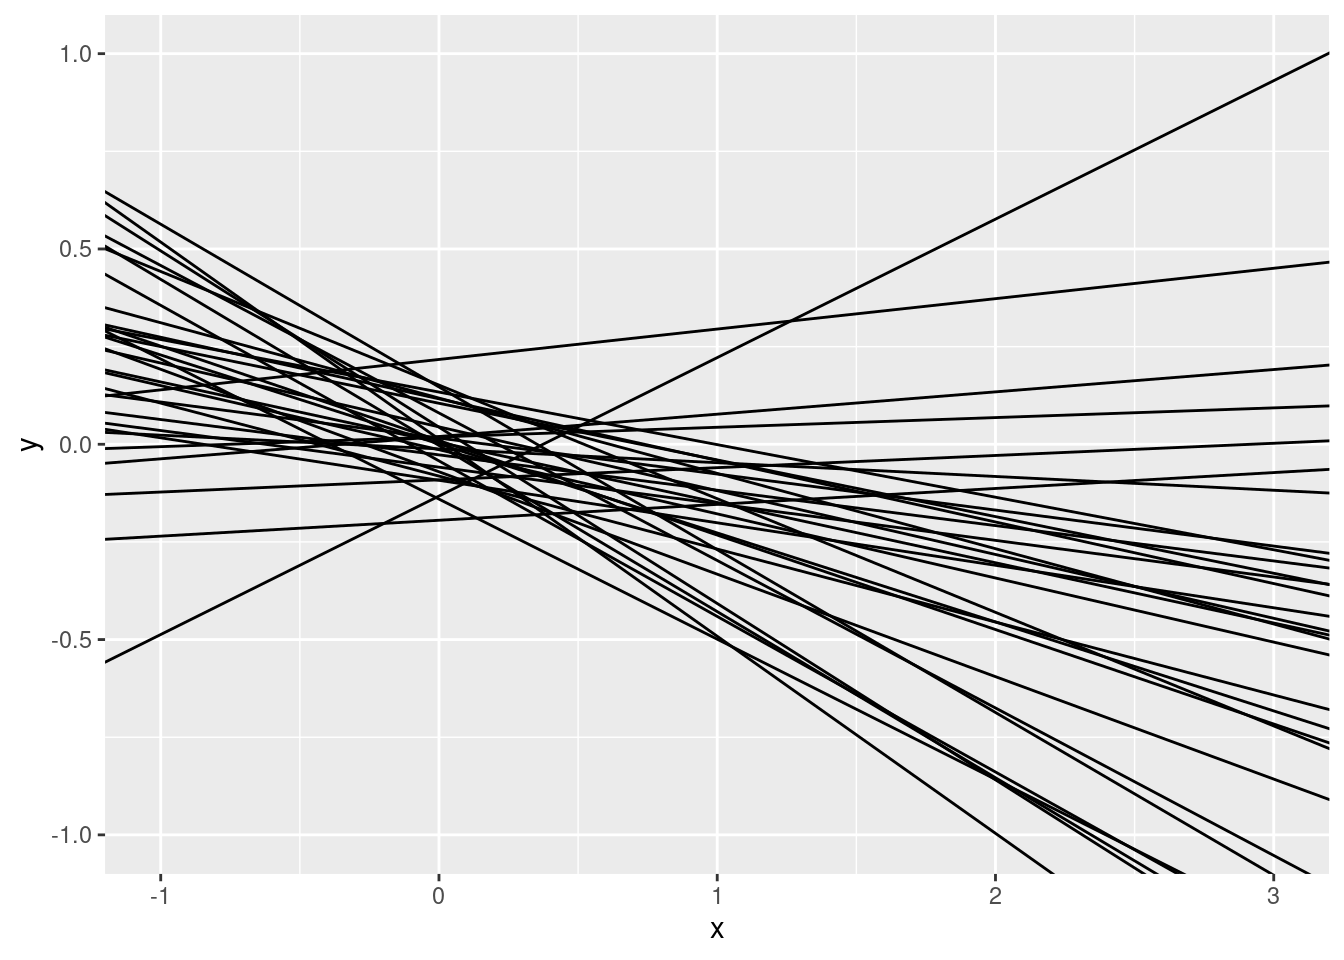
Which combination of \(\tau_0\) and \(\tau_1\) best describes the graph below?


Interpretations

Check your learning
In a random-slope model, if \(\gamma_{10}\) (the average slope) = 0.2, \(\tau^2_1 = 0.04\), what is the 68% plausible range for the slopes across clusters?


In the video, there was a mistake in the path diagram, in that one of the circle should be \(\beta_{1j}\), not \(\beta_{0j}\)

Check your learning
Conceptually, a cross-level interaction is the same as