Model Diagnostics
PSYC 575
Mark Lai
University of Southern California
2021/09/25 (updated: 2022-10-02)
Week Learning Objectives
Describe the major assumptions in basic multilevel models
Conduct analyses to decide whether cluster means and random slopes should be included
Use graphical tools to diagnose assumptions of linearity, homoscedasticity (equal variance), and normality
Solve some basic convergence issues
Report results of a multilevel analysis based on established guidelines
Multilevel "Model" . . .
What is a model?
Multilevel "Model" . . .
What is a model?
It is a set of assumptions about how the data are generated
Two Components of a Parametric Model
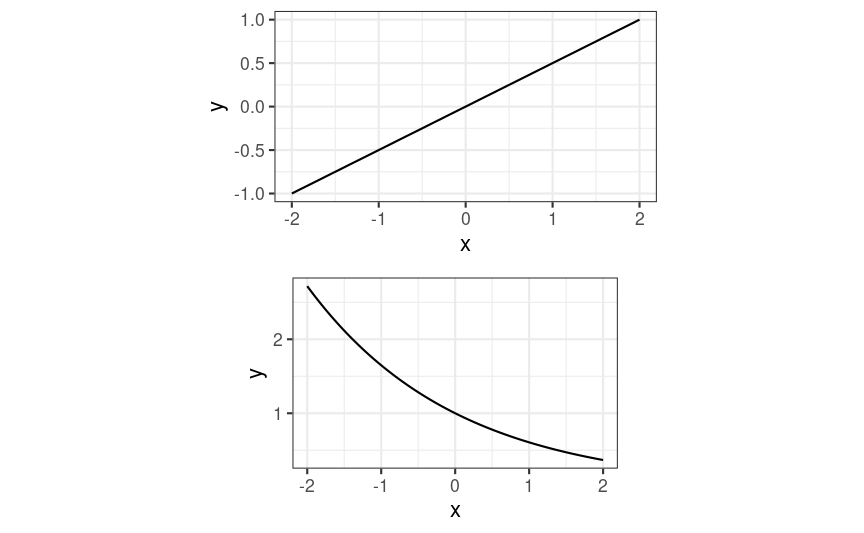
Functional Form
E(Yij|X,W)=γ00+γ10X1ij+…+γ01W1j+…
Versus:
E(Yij|X,W)=exp(γ00+γ10X1ij+…+γ01W1j+…)
Two Components of a Parametric Model
Random Component
I.e., distribution of random effects/errors
[u0ju1j]∼N([00],[τ20τ01τ01τ21])
eij∼N(0,σ)
Two Components of a Parametric Model
Random Component
I.e., distribution of random effects/errors
[u0ju1j]∼N([00],[τ20τ01τ01τ21])
eij∼N(0,σ)
Versus eij∼t3(0,σ)
Two Components of a Parametric Model
Random Component
I.e., distribution of random effects/errors
[u0ju1j]∼N([00],[τ20τ01τ01τ21])
eij∼N(0,σ)
Versus eij∼t3(0,σ)
Or eij∼N(0,σj), where different clusters j have a different SD σj
Assumptions of Basic MLM
Five Assumptions in Normal Linear Models
Linearity
Independence of errors (at the highest level)
Normality
Equal variance of errors (i.e., homoscedasticity)
Correct Specification of the model
Five Assumptions in Normal Linear Models
Linearity
Independence of errors (at the highest level)
Normality
Equal variance of errors (i.e., homoscedasticity)
Correct Specification of the model
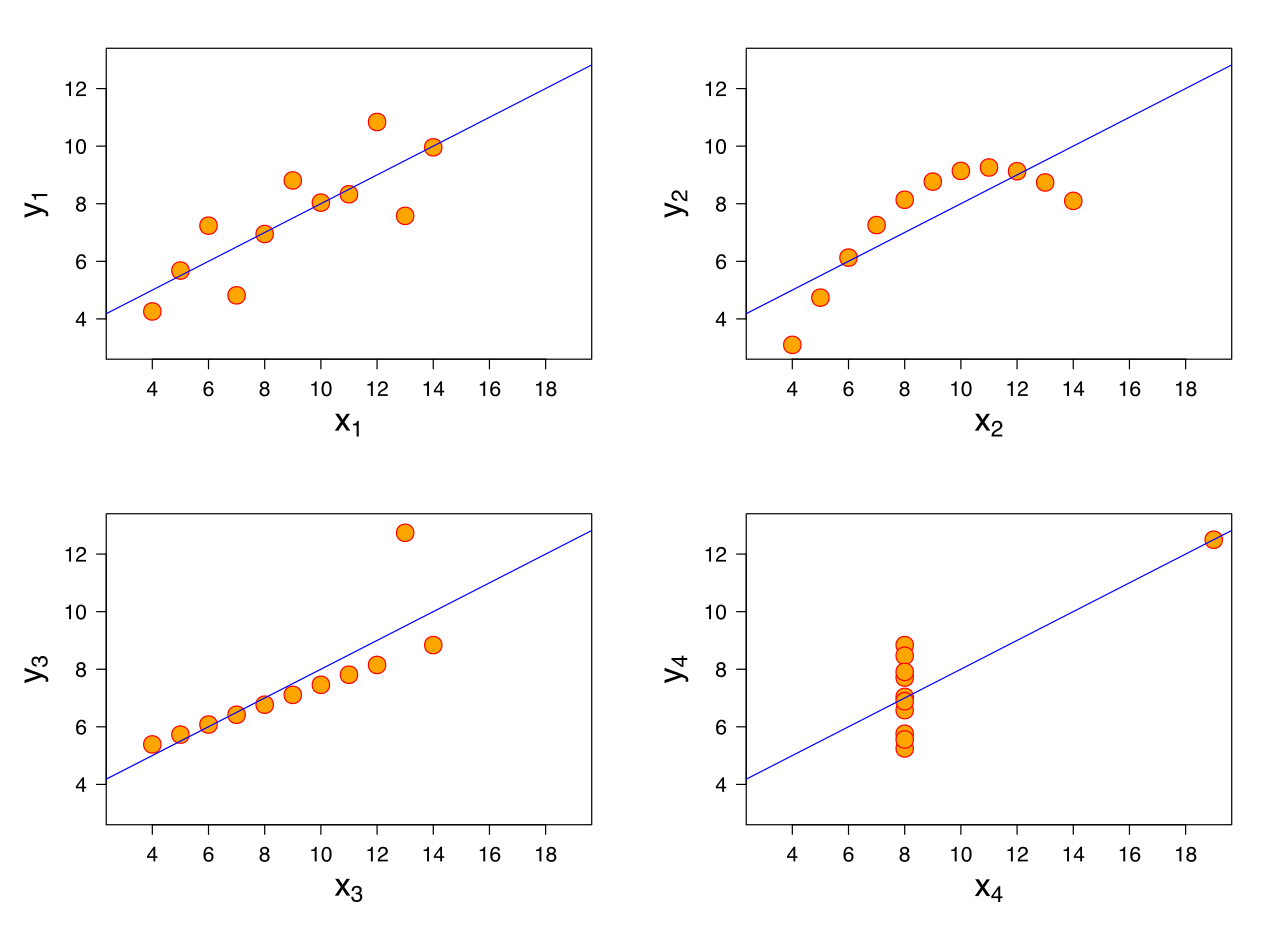
Importance: S, L, I > E, N
Assumptions Are Important
Your result is only as good as the assumptions
- Garbage in, garbage out
Assumptions Are Important
Your result is only as good as the assumptions
- Garbage in, garbage out
Correct Specification
Fixed effects
Cluster means should be included (unless between coefficient = within coefficient)
- Otherwise, between and within coefficients are conflated
Relevant predictors should be included to answer the target research question
- E.g., Gender gap vs. gender gap adjusting for profession
Random effects
If random slope variance is not zero, omitting it leads to inflated Type I error rates for fixed effects
- Varying slopes could also be important information from the data
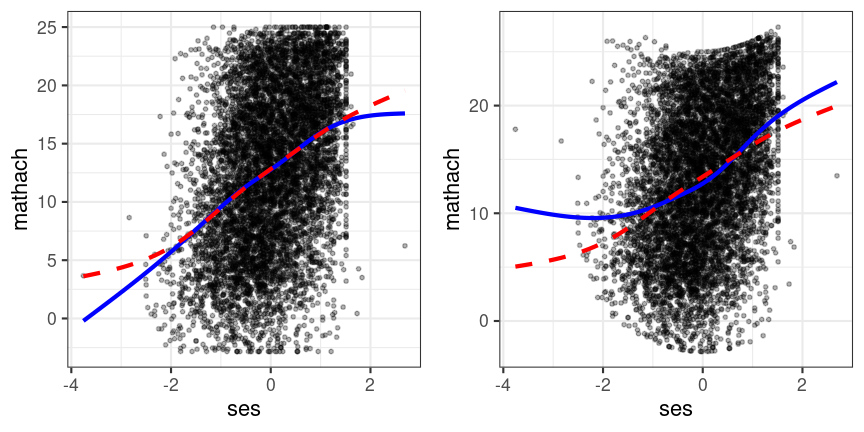
Linearity
Lack of linear association ≠ lack of association
Independence of Errors
We use MLM because students within the same school are more similar (i.e., not independent)
Independence of Errors
We use MLM because students within the same school are more similar (i.e., not independent)
If schools are from different school districts, they may also not be independent
- Need a three-level model
Independence of Errors
We use MLM because students within the same school are more similar (i.e., not independent)
If schools are from different school districts, they may also not be independent
- Need a three-level model
Or, student A in school 1 is from the same neighborhood as student B in school 2
- Cross-classified model
Temporal dependence
E.g., Repeated measures closer in time are more similar
- Autoregressive model
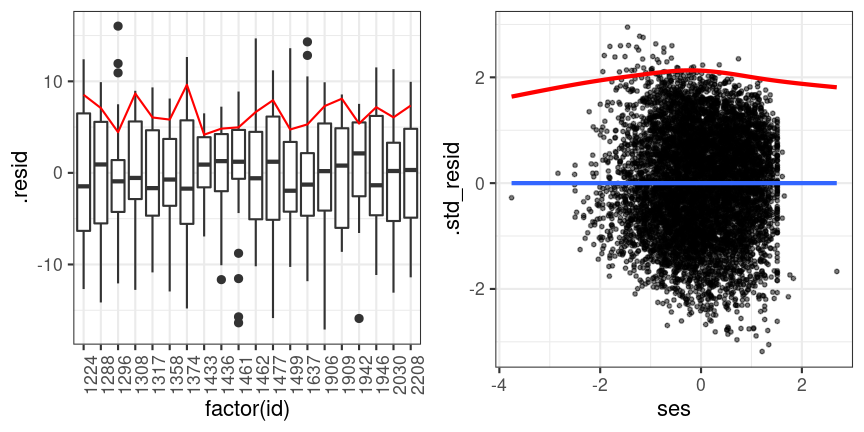
Equal Variance of Errors (Homoscedasticity)
Residual plots
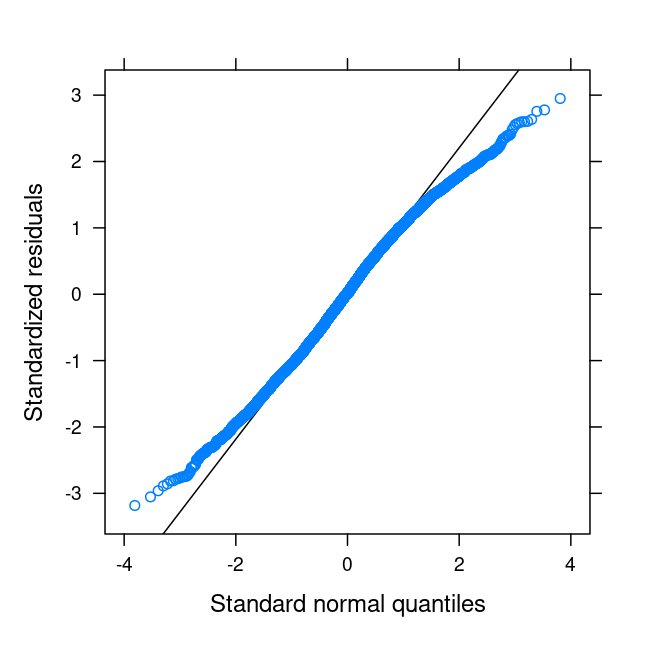
Normality
Quantile-quantile (QQ) plot
- Whether the 1st, 5th, 10th, ... percentiles of the residuals correspond to the 1st, 5th, 10th, ... percentiles of a normal distribution
Need to check both level 1 (e) and level 2 (u0 and u1)
Examples of data for which a normal model is not good
Binary/ordinal outcome with < 5 categories (including the homework)
Count data (e.g., # binge drinking episodes; # of success in 5 trials)
Bounded data with ceiling/floor effects (e.g., depressive symptoms)
Reaction time
Additional Issues
- Outliers/influential observations
- Check coding error
- Don't drop outliers unless you adjust the standard errors accordingly, or use robust models
Additional Issues
- Outliers/influential observations
- Check coding error
- Don't drop outliers unless you adjust the standard errors accordingly, or use robust models
- Reliability (e.g., α coefficient)
- Reliability may be high at one level but low at another level
- See Lai (2021, doi: 10.1037/met0000287) for level-specific reliability
- You can use the
multilevel_alpha()function from https://github.com/marklhc/mcfa_reliability_supp/blob/master/multilevel_alpha.R - The procedure was recently implemented in the
semTools::compRelSEM()function, thanks to Dr. Terrence D. Jorgensen.
- You can use the
Dealing With Convergence Issues
See R codes
Reporting Results
References
- Chapter by McCoach (2019); Paper by Meteyard & Davies (2020)
References
- Chapter by McCoach (2019); Paper by Meteyard & Davies (2020)
Things to report:
- Sample sizes
- Model equations
- Decisions and justifications for including or not including cluster means, centering, and random slopes
- Estimation methods, software program/package, and version number
- Intraclass correlation
- Convergence issues and handling
- Assumptions
- Tables of fixed and random effect coefficients
- Effect size
- Model comparison criteria and indices
- Software code