class: center, middle, inverse, title-slide .title[ # Model Estimation and Testing ] .subtitle[ ## PSYC 575 ] .author[ ### Mark Lai ] .institute[ ### University of Southern California ] .date[ ### 2020/09/01 (updated: 2022-09-17) ] --- <style>.shareagain-bar { --shareagain-foreground: rgb(255, 255, 255); --shareagain-background: rgba(0, 0, 0, 0.5); --shareagain-twitter: none; --shareagain-facebook: none; --shareagain-linkedin: none; --shareagain-pinterest: none; --shareagain-pocket: none; --shareagain-reddit: none; }</style> `$$\newcommand{\bv}[1]{\boldsymbol{\mathbf{#1}}}$$` # Week Learning Objectives - Describe, conceptually, what the **likelihood function** and maximum likelihood estimation are - Describe the differences between **maximum likelihood** and **restricted maximum likelihood** - Conduct statistical tests for fixed effects, and use the **small-sample correction** when needed - Use the **likelihood ratio test** to test random slopes - Estimate multilevel models with the Bayesian/Markov Chain Monte Carlo estimator in the `brms` package --- # Estimation <img src="img/model_sample.png" width="70%" height="40%" style="display: block; margin: auto;" /> Regression: OLS MLM: Maximum likelihood, Bayesian --- class: middle # Why should I learn about estimation methods? -- - ## Understand software options -- - ## Know when to use better methods -- - ## Needed for reporting --- ### The most commonly used methods in MLM are ### maximum likelihood (ML) and restricted maximum likelihood (REML) ``` *># Linear mixed model fit by REML ['lmerMod'] ># Formula: Reaction ~ Days + (Days | Subject) ># Data: sleepstudy ># REML criterion at convergence: 1744 ># Random effects: ># Groups Name Std.Dev. Corr ># Subject (Intercept) 24.74 ># Days 5.92 0.07 ># Residual 25.59 ># Number of obs: 180, groups: Subject, 18 ># Fixed Effects: ># (Intercept) Days ># 251.4 10.5 ``` --- class: inverse, center, middle # Estimation Methods for MLM --- # For MLM Find `\(\gamma\)`s, `\(\tau\)`s, and `\(\sigma\)` that maximizes the likelihood function `$$\ell(\bv \gamma, \bv \tau, \sigma; \bv y) = - \frac{1}{2} \left\{\log | \bv V(\bv \tau, \sigma)| + (\bv y - \bv X \bv \gamma)^\top \bv V^{-1}(\bv \tau, \sigma) (\bv y - \bv X \bv \gamma) \right\} + K$$` Here's the log-likelihood function for the coefficient of `meanses` (see code in the provided Rmd): .pull-left[ <img src="05_model_estimation_and_testing_files/figure-html/loglik-meanses-1.png" width="70%" style="display: block; margin: auto;" /> ] .pull-right[ <img src="05_model_estimation_and_testing_files/figure-html/deviance-gamma01-1.png" width="70%" style="display: block; margin: auto;" /> ] --- # Numerical Algorithms .pull-left[ ``` ># iteration: 1 ># f(x) = 47022.519159 ># iteration: 2 ># f(x) = 47151.291766 ># iteration: 3 ># f(x) = 47039.480137 ># iteration: 4 ># f(x) = 46974.909593 ># iteration: 5 ># f(x) = 46990.872588 ># iteration: 6 ># f(x) = 46966.453125 ># iteration: 7 ># f(x) = 46961.719993 ># iteration: 8 ># f(x) = 46965.890703 ># iteration: 9 ># f(x) = 46961.367013 ># iteration: 10 ># f(x) = 46961.288830 ># iteration: 11 ># f(x) = 46961.298898 ># iteration: 12 ># f(x) = 46961.284848 ># iteration: 13 ># f(x) = 46961.285238 ># iteration: 14 ># f(x) = 46961.284845 ># iteration: 15 ># f(x) = 46961.284848 ># iteration: 16 ># f(x) = 46961.284845 ``` ] .pull-right[ <img src="05_model_estimation_and_testing_files/figure-html/deviance-gamma01-2-1.png" width="70%" style="display: block; margin: auto;" /> ] --- # ML vs. REML REML has corrected degrees of freedom for the variance component estimates (like dividing by `\(N - 1\)` instead of by `\(N\)` in estimating variance) - REML is generally preferred in smaller samples - The difference is small when the number of clusters is large Technically speaking, REML only estimates the variance components<sup>1</sup> .footnote[ [1] The fixed effects are integrated out and are not part of the likelihood function. They are solved in a second step, usually by the generalized least squares (GLS) method ] --- .pull-left[ ### 160 Schools <table class="table" style="width: auto !important; margin-left: auto; margin-right: auto;"> <thead> <tr> <th style="text-align:left;"> </th> <th style="text-align:center;"> REML </th> <th style="text-align:center;"> ML </th> </tr> </thead> <tbody> <tr> <td style="text-align:left;"> (Intercept) </td> <td style="text-align:center;"> 12.649 </td> <td style="text-align:center;"> 12.650 </td> </tr> <tr> <td style="text-align:left;"> </td> <td style="text-align:center;"> (0.149) </td> <td style="text-align:center;"> (0.148) </td> </tr> <tr> <td style="text-align:left;"> meanses </td> <td style="text-align:center;"> 5.864 </td> <td style="text-align:center;"> 5.863 </td> </tr> <tr> <td style="text-align:left;"> </td> <td style="text-align:center;"> (0.361) </td> <td style="text-align:center;"> (0.359) </td> </tr> <tr> <td style="text-align:left;"> SD (Intercept id) </td> <td style="text-align:center;"> 1.624 </td> <td style="text-align:center;"> 1.610 </td> </tr> <tr> <td style="text-align:left;box-shadow: 0px 1px"> SD (Observations) </td> <td style="text-align:center;box-shadow: 0px 1px"> 6.258 </td> <td style="text-align:center;box-shadow: 0px 1px"> 6.258 </td> </tr> <tr> <td style="text-align:left;"> Num.Obs. </td> <td style="text-align:center;"> 7185 </td> <td style="text-align:center;"> 7185 </td> </tr> <tr> <td style="text-align:left;"> R2 Marg. </td> <td style="text-align:center;"> 0.123 </td> <td style="text-align:center;"> 0.123 </td> </tr> <tr> <td style="text-align:left;"> R2 Cond. </td> <td style="text-align:center;"> 0.179 </td> <td style="text-align:center;"> 0.178 </td> </tr> <tr> <td style="text-align:left;"> AIC </td> <td style="text-align:center;"> 46969.3 </td> <td style="text-align:center;"> 46969.3 </td> </tr> <tr> <td style="text-align:left;"> BIC </td> <td style="text-align:center;"> 46996.8 </td> <td style="text-align:center;"> 46996.8 </td> </tr> <tr> <td style="text-align:left;"> ICC </td> <td style="text-align:center;"> 0.1 </td> <td style="text-align:center;"> 0.1 </td> </tr> <tr> <td style="text-align:left;"> RMSE </td> <td style="text-align:center;"> 6.21 </td> <td style="text-align:center;"> 6.21 </td> </tr> </tbody> </table> ] -- .pull-right[ ### 16 Schools <table class="table" style="width: auto !important; margin-left: auto; margin-right: auto;"> <thead> <tr> <th style="text-align:left;"> </th> <th style="text-align:center;"> REML </th> <th style="text-align:center;"> ML </th> </tr> </thead> <tbody> <tr> <td style="text-align:left;"> (Intercept) </td> <td style="text-align:center;"> 12.809 </td> <td style="text-align:center;"> 12.808 </td> </tr> <tr> <td style="text-align:left;"> </td> <td style="text-align:center;"> (0.504) </td> <td style="text-align:center;"> (0.471) </td> </tr> <tr> <td style="text-align:left;"> meanses </td> <td style="text-align:center;"> 6.577 </td> <td style="text-align:center;"> 6.568 </td> </tr> <tr> <td style="text-align:left;"> </td> <td style="text-align:center;"> (1.281) </td> <td style="text-align:center;"> (1.197) </td> </tr> <tr> <td style="text-align:left;"> SD (Intercept id) </td> <td style="text-align:center;"> 1.726 </td> <td style="text-align:center;"> 1.581 </td> </tr> <tr> <td style="text-align:left;box-shadow: 0px 1px"> SD (Observations) </td> <td style="text-align:center;box-shadow: 0px 1px"> 5.944 </td> <td style="text-align:center;box-shadow: 0px 1px"> 5.944 </td> </tr> <tr> <td style="text-align:left;"> Num.Obs. </td> <td style="text-align:center;"> 686 </td> <td style="text-align:center;"> 686 </td> </tr> <tr> <td style="text-align:left;"> R2 Marg. </td> <td style="text-align:center;"> 0.145 </td> <td style="text-align:center;"> 0.146 </td> </tr> <tr> <td style="text-align:left;"> R2 Cond. </td> <td style="text-align:center;"> 0.211 </td> <td style="text-align:center;"> 0.203 </td> </tr> <tr> <td style="text-align:left;"> AIC </td> <td style="text-align:center;"> 4419.6 </td> <td style="text-align:center;"> 4419.7 </td> </tr> <tr> <td style="text-align:left;"> BIC </td> <td style="text-align:center;"> 4437.7 </td> <td style="text-align:center;"> 4437.8 </td> </tr> <tr> <td style="text-align:left;"> ICC </td> <td style="text-align:center;"> 0.1 </td> <td style="text-align:center;"> 0.1 </td> </tr> <tr> <td style="text-align:left;"> RMSE </td> <td style="text-align:center;"> 5.89 </td> <td style="text-align:center;"> 5.89 </td> </tr> </tbody> </table> ] --- # Other Estimation Methods ### Generalized estimating equations (GEE) - Robust to some misspecification and non-normality - Maybe inefficient in small samples (i.e., with lower power) - See Snijders & Bosker 12.2; the `geepack` R package ### Markov Chain Monte Carlo (MCMC)/Bayesian - Researchers set prior distributions for the parameters * Different from "empirical Bayes": Prior coming from the data - Does not depend on normality of the sampling distributions * More stable in small samples with the use of priors - Can handle complex models - See Snijders & Bosker 12.1 --- class: inverse, middle, center # Testing --- ### Fixed effects `\((\gamma)\)` - Usually, the likelihood-based CI/likelihood-ratio (LRT; `\(\chi^2\)`) test is sufficient * Require ML (as fixed effects are not part of the likelihood function in REML) - Small sample (10--50 clusters): Kenward-Roger approximation of degrees of freedom - Non-normality: Residual bootstrap<sup>1</sup> ### Random effects `\((\tau)\)` - LRT (with `\(p\)` values divided by 2) .footnote[ [1]: See [van der Leeden et al. (2008)](https://link-springer-com.libproxy1.usc.edu/chapter/10.1007/978-0-387-73186-5_11) and [Lai (2021)](https://doi.org/10.1080/00273171.2020.1746902) ] --- class: inverse, middle, center # Testing Fixed Effects --- # Likelihood Ratio (Deviance) Test ### `\(H_0: \gamma = 0\)` -- Likelihood ratio: `\(\dfrac{L(\gamma = 0)}{L(\gamma = \hat \gamma)}\)` Deviance: `\(-2 \times \log\left(\frac{L(\gamma = 0)}{L(\gamma = \hat \gamma)}\right)\)` = `\(-2 \mathrm{LL}(\gamma = 0) - [-2 \mathrm{LL}(\gamma = \hat \gamma)]\)` = `\(\mathrm{Deviance} \mid_{\gamma = 0} - \mathrm{Deviance} \mid_{\gamma = \hat \gamma}\)` ML (instead of REML) should be used --- # Example ``` ... ># Linear mixed model fit by maximum likelihood ['lmerMod'] ># Formula: mathach ~ (1 | id) ># AIC BIC logLik deviance df.resid ># 47122 47142 -23558 47116 7182 ... ``` ``` ... ># Linear mixed model fit by maximum likelihood ['lmerMod'] ># Formula: mathach ~ meanses + (1 | id) ># AIC BIC logLik deviance df.resid ># 46967 46995 -23480 46959 7181 ... ``` ```r pchisq(47115.81 - 46959.11, df = 1, lower.tail = FALSE) ``` ``` ># [1] 5.95e-36 ``` In `lme4`, you can also use ```r anova(m_lv2, ran_int) # Automatically use ML ``` --- # Problem of LRT in Small Samples .pull-left[ LRT assumes that the deviance under the null follows a `\(\chi^2\)` distribution, which is not likely to hold in small samples - Inflated Type I error rates E.g., 16 Schools - LRT critical value with `\(\alpha = .05\)`: 3.84 - Simulation-based critical value: 4.72 ] -- .pull-right[ <img src="05_model_estimation_and_testing_files/figure-html/est-vs-boot-samp-dist-1.png" width="80%" style="display: block; margin: auto;" /> ] --- # `\(F\)` Test With Small-Sample Correction It is based on the Wald test (not the LRT): - `\(t = \hat{\gamma} / \hat{\mathrm{se}}(\hat{\gamma})\)`, - Or equivalently, the `\(F = t^2\)` (for a one-parameter test) The small-sample correction does two things: - Adjust `\(\hat{\mathrm{se}}(\hat{\gamma})\)` as it tends to be underestimated in small samples - Determine the critical value based on an `\(F\)` distribution, with an approximate **denominator degrees of freedom (ddf)** --- # Kenward-Roger (1997) Correction Generally performs well with < 50 clusters .pull-left[ ```r # Wald anova(m_contextual, ddf = "lme4") ``` ``` ># Analysis of Variance Table ># npar Sum Sq Mean Sq F value ># meanses 1 860 860 26.4 ># ses 1 1874 1874 57.5 ``` ] .pull-right[ ```r # K-R anova(m_contextual, ddf = "Kenward-Roger") ``` ``` ># Type III Analysis of Variance Table with Kenward-Roger's method ># Sum Sq Mean Sq NumDF DenDF F value Pr(>F) ># meanses 324 324 1 16 9.96 0.0063 ** ># ses 1874 1874 1 669 57.53 1.1e-13 *** ># --- ># Signif. codes: 0 '***' 0.001 '**' 0.01 '*' 0.05 '.' 0.1 ' ' 1 ``` ] For `meanses`, the critical value (and the `\(p\)` value) is determined based on an `\(F(1, 15.51)\)` distribution, which has a critical value of ```r qf(.95, df1 = 1, df2 = 15.51) ``` ``` ># [1] 4.52 ``` --- class: inverse, middle, center # Testing Random Effects --- # LRT for Random Slopes .pull-left[ ### Should you include random slopes? Theoretically, yes, unless you're certain that the slopes are the same for every group However, frequentist methods usually crash with more than two random slopes - Test the random slopes one by one, and identify which one is needed - Bayesian methods are more equipped for complex models ] -- .pull-right[ ### "One-tailed" LRT LRT `\((\chi^2)\)` is generally a two-tailed test. But for random slopes, `\(H_0: \tau_1 = 0\)` is a one-tailed hypothesis A quick solution is to divide the resulting `\(p\)` by 2<sup>1</sup> .footnote[ [1]: Originally proposed by Snijders & Bosker; tested in simulation by LaHuis & Ferguson (2009, https://doi.org/10.1177/1094428107308984) ] ] --- # Example: LRT for `\(\tau^2_1\)` .pull-left[ ``` ... ># Formula: mathach ~ meanses + ses_cmc + (ses_cmc | id) ># Data: hsball ># REML criterion at convergence: 46558 ... ``` ``` ... ># Formula: mathach ~ meanses + ses_cmc + (1 | id) ># Data: hsball ># REML criterion at convergence: 46569 ... ``` ] -- .pull-right[ .center[ ### G Matrix `$$\begin{bmatrix} \tau^2_0 & \\ \tau_{01} & \tau^2_1 \\ \end{bmatrix}$$` `$$\begin{bmatrix} \tau^2_0 & \\ {\color{red}0} & {\color{red}0} \\ \end{bmatrix}$$` ] ] -- ```r pchisq(10.92681, df = 2, lower.tail = FALSE) ``` ``` ># [1] 0.00424 ``` Need to divide by 2 --- class: inverse, middle, center # Bayesian Estimation --- # Benefits - Better small sample properties - Less likely to have convergence issues - CIs available for any quantities (`\(R^2\)`, predictions, etc) - Support complex models not possible with `lme4` * E.g., 2+ random slopes - Is getting increasingly popular in recent research --- # Downsides - Computationally more intensive * But dealing with convergence issues with ML/REML may end up taking more time - Need to learn some new terminologies --- # Bayes's Theorem ### Posterior `\(\propto\)` Likelihood `\(\times\)` Prior - So, in addition to the likelihood function (as in ML/REML), we need prior information - Prior: Belief about a parameter before looking at the data - For this course, we use default priors set by the `brms` package * Note that the default priors may change when software gets updated, so keep track of the package version when you run analyses --- 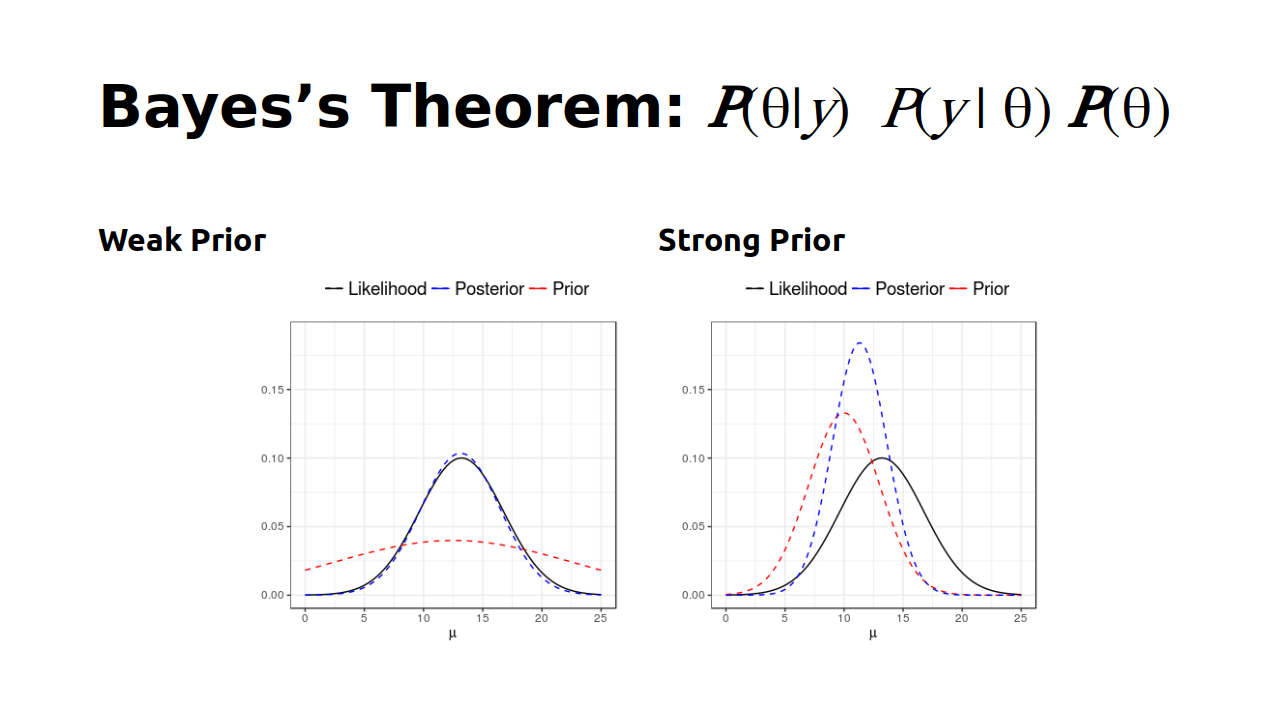 --- .pull-left[ <table class="table" style="width: auto !important; margin-left: auto; margin-right: auto;"> <thead> <tr> <th style="text-align:left;"> </th> <th style="text-align:center;"> MCMC </th> </tr> </thead> <tbody> <tr> <td style="text-align:left;"> b_Intercept </td> <td style="text-align:center;"> 12.647 </td> </tr> <tr> <td style="text-align:left;"> </td> <td style="text-align:center;"> [12.348, 12.939] </td> </tr> <tr> <td style="text-align:left;"> b_meanses </td> <td style="text-align:center;"> 5.854 </td> </tr> <tr> <td style="text-align:left;"> </td> <td style="text-align:center;"> [5.141, 6.606] </td> </tr> <tr> <td style="text-align:left;"> sd_id__Intercept </td> <td style="text-align:center;"> 1.633 </td> </tr> <tr> <td style="text-align:left;"> </td> <td style="text-align:center;"> [1.386, 1.901] </td> </tr> <tr> <td style="text-align:left;"> sigma </td> <td style="text-align:center;"> 6.258 </td> </tr> <tr> <td style="text-align:left;box-shadow: 0px 1px"> </td> <td style="text-align:center;box-shadow: 0px 1px"> [6.159, 6.365] </td> </tr> <tr> <td style="text-align:left;"> Num.Obs. </td> <td style="text-align:center;"> 7185 </td> </tr> <tr> <td style="text-align:left;"> R2 </td> <td style="text-align:center;"> 0.173 </td> </tr> <tr> <td style="text-align:left;"> R2 Adj. </td> <td style="text-align:center;"> 0.158 </td> </tr> <tr> <td style="text-align:left;"> R2 Marg. </td> <td style="text-align:center;"> 0.123 </td> </tr> <tr> <td style="text-align:left;"> ELPD </td> <td style="text-align:center;"> −23433.7 </td> </tr> <tr> <td style="text-align:left;"> ELPD s.e. </td> <td style="text-align:center;"> 49.7 </td> </tr> <tr> <td style="text-align:left;"> LOOIC </td> <td style="text-align:center;"> 46867.5 </td> </tr> <tr> <td style="text-align:left;"> LOOIC s.e. </td> <td style="text-align:center;"> 99.4 </td> </tr> <tr> <td style="text-align:left;"> WAIC </td> <td style="text-align:center;"> 46867.1 </td> </tr> <tr> <td style="text-align:left;"> RMSE </td> <td style="text-align:center;"> 6.21 </td> </tr> <tr> <td style="text-align:left;"> r2.adjusted.marginal </td> <td style="text-align:center;"> 0.116 </td> </tr> </tbody> </table> ] .pull-right[ ### Testing for Bayesian Estimation A coefficient is statistically different from zero when the 95% CI does not contain zero. ] --- class: inverse, middle, center # Multilevel Bootstrap --- A simulation-based approach to approximate the sampling distribution of fixed and random effects - Useful for obtaining CIs - Especially for statistics that are functions of fixed/random effects (e.g., `\(R^2\)`) Parametric, Residual, and Cases bootstrap --  --- In my own work,<sup>1</sup> the residual bootstrap was found to perform best, especially when data are not normally distributed and when the number of clusters is small See R code for this week .footnote[ Lai (2021, https://doi.org/10.1080/00273171.2020.1746902) ] --- class: inverse, middle, center # Bonus: More on Maximum Likelihood Estimation --- # What is Likelihood? .pull-left[ ### Let's say we want to estimate the population mean math achievement score `\((\mu)\)` We need to make some assumptions: - Known *SD*: `\(\sigma = 8\)` - The scores are normally distributed in the population ] .pull-right[ <img src="05_model_estimation_and_testing_files/figure-html/lik-pop-1.png" width="100%" style="display: block; margin: auto;" /> ] --- # Learning the Parameter From the Sample Assume that we have scores from 5 representative students <table> <thead> <tr> <th style="text-align:right;"> Student </th> <th style="text-align:right;"> Score </th> </tr> </thead> <tbody> <tr> <td style="text-align:right;"> 1 </td> <td style="text-align:right;"> 23 </td> </tr> <tr> <td style="text-align:right;"> 2 </td> <td style="text-align:right;"> 16 </td> </tr> <tr> <td style="text-align:right;"> 3 </td> <td style="text-align:right;"> 5 </td> </tr> <tr> <td style="text-align:right;"> 4 </td> <td style="text-align:right;"> 14 </td> </tr> <tr> <td style="text-align:right;"> 5 </td> <td style="text-align:right;"> 7 </td> </tr> </tbody> </table> --- # Likelihood If we **assume** that `\(\mu = 10\)`, how likely will we get 5 students with these scores? .pull-left[ <img src="05_model_estimation_and_testing_files/figure-html/lik-pop-10-1.png" width="90%" style="display: block; margin: auto;" /> ] -- .pull-right[ <table> <thead> <tr> <th style="text-align:right;"> Student </th> <th style="text-align:right;"> Score </th> <th style="text-align:right;"> `\(P(Y_i = y_i \mid \mu = 10)\)` </th> </tr> </thead> <tbody> <tr> <td style="text-align:right;"> 1 </td> <td style="text-align:right;"> 23 </td> <td style="text-align:right;"> 0.013 </td> </tr> <tr> <td style="text-align:right;"> 2 </td> <td style="text-align:right;"> 16 </td> <td style="text-align:right;"> 0.038 </td> </tr> <tr> <td style="text-align:right;"> 3 </td> <td style="text-align:right;"> 5 </td> <td style="text-align:right;"> 0.041 </td> </tr> <tr> <td style="text-align:right;"> 4 </td> <td style="text-align:right;"> 14 </td> <td style="text-align:right;"> 0.044 </td> </tr> <tr> <td style="text-align:right;"> 5 </td> <td style="text-align:right;"> 7 </td> <td style="text-align:right;"> 0.046 </td> </tr> </tbody> </table> Multiplying them all together: `$$P(Y_1 = 23, Y_2 = 16, Y_3 = 5, Y_4 = 14, Y_5 = 7 | \mu = 10)$$` = Product of the probabilities = ``` ># [1] 4.21e-08 ``` ] --- # If `\(\mu = 13\)` .pull-left[ <img src="05_model_estimation_and_testing_files/figure-html/lik-pop-13-1.png" width="100%" style="display: block; margin: auto;" /> ] -- .pull-right[ <table> <thead> <tr> <th style="text-align:right;"> Student </th> <th style="text-align:right;"> Score </th> <th style="text-align:right;"> `\(P(Y_i = y_i \mid \mu = 13)\)` </th> </tr> </thead> <tbody> <tr> <td style="text-align:right;"> 1 </td> <td style="text-align:right;"> 23 </td> <td style="text-align:right;"> 0.023 </td> </tr> <tr> <td style="text-align:right;"> 2 </td> <td style="text-align:right;"> 16 </td> <td style="text-align:right;"> 0.046 </td> </tr> <tr> <td style="text-align:right;"> 3 </td> <td style="text-align:right;"> 5 </td> <td style="text-align:right;"> 0.030 </td> </tr> <tr> <td style="text-align:right;"> 4 </td> <td style="text-align:right;"> 14 </td> <td style="text-align:right;"> 0.049 </td> </tr> <tr> <td style="text-align:right;"> 5 </td> <td style="text-align:right;"> 7 </td> <td style="text-align:right;"> 0.038 </td> </tr> </tbody> </table> Multiplying them all together: `$$P(Y_1 = 23, Y_2 = 16, Y_3 = 5, Y_4 = 14, Y_5 = 7 | \mu = 13)$$` = Product of the probabilities = ``` ># [1] 5.98e-08 ``` ] --- Compute the likelihood for a range of `\(\mu\)` values .pull-left[ # Likelihood Function <img src="05_model_estimation_and_testing_files/figure-html/lik-func-1.png" width="90%" style="display: block; margin: auto;" /> ] -- .pull-right[ # Log-Likelihood (LL) Function <img src="05_model_estimation_and_testing_files/figure-html/llik-func-1.png" width="90%" style="display: block; margin: auto;" /> ] --- .pull-left[ # Maximum Likelihood `\(\hat \mu = 13\)` maximizes the (log) likelihood function Maximum likelihood estimator (MLE) ] -- .pull-right[ ## Estimating `\(\sigma\)` <img src="05_model_estimation_and_testing_files/figure-html/llik-func-sigma-1.png" width="90%" style="display: block; margin: auto;" /> ] --- # Curvature and Standard Errors .pull-left[ `\(N = 5\)` <img src="05_model_estimation_and_testing_files/figure-html/mle-ase1-1.png" width="90%" style="display: block; margin: auto;" /> ] .pull-right[ `\(N = 20\)` <img src="05_model_estimation_and_testing_files/figure-html/mle-ase2-1.png" width="90%" style="display: block; margin: auto;" /> ]